Two paths to the same goal
Every airport digital twin starts with a fundamental question: how do you capture the geometry of a real airport and turn it into something a computer can render? Two technologies dominate this space. Photogrammetry uses overlapping photographs to reconstruct 3D geometry. LiDAR uses laser pulses to measure distances and build point clouds directly. Both can produce high-fidelity airport models. But they work differently, cost differently, and each has distinct advantages depending on the project.
Understanding the trade-offs between these methods isn't academic. The capture method you choose determines the accuracy ceiling of your model, the texture quality of your surfaces, and in many cases the overall project timeline and budget.
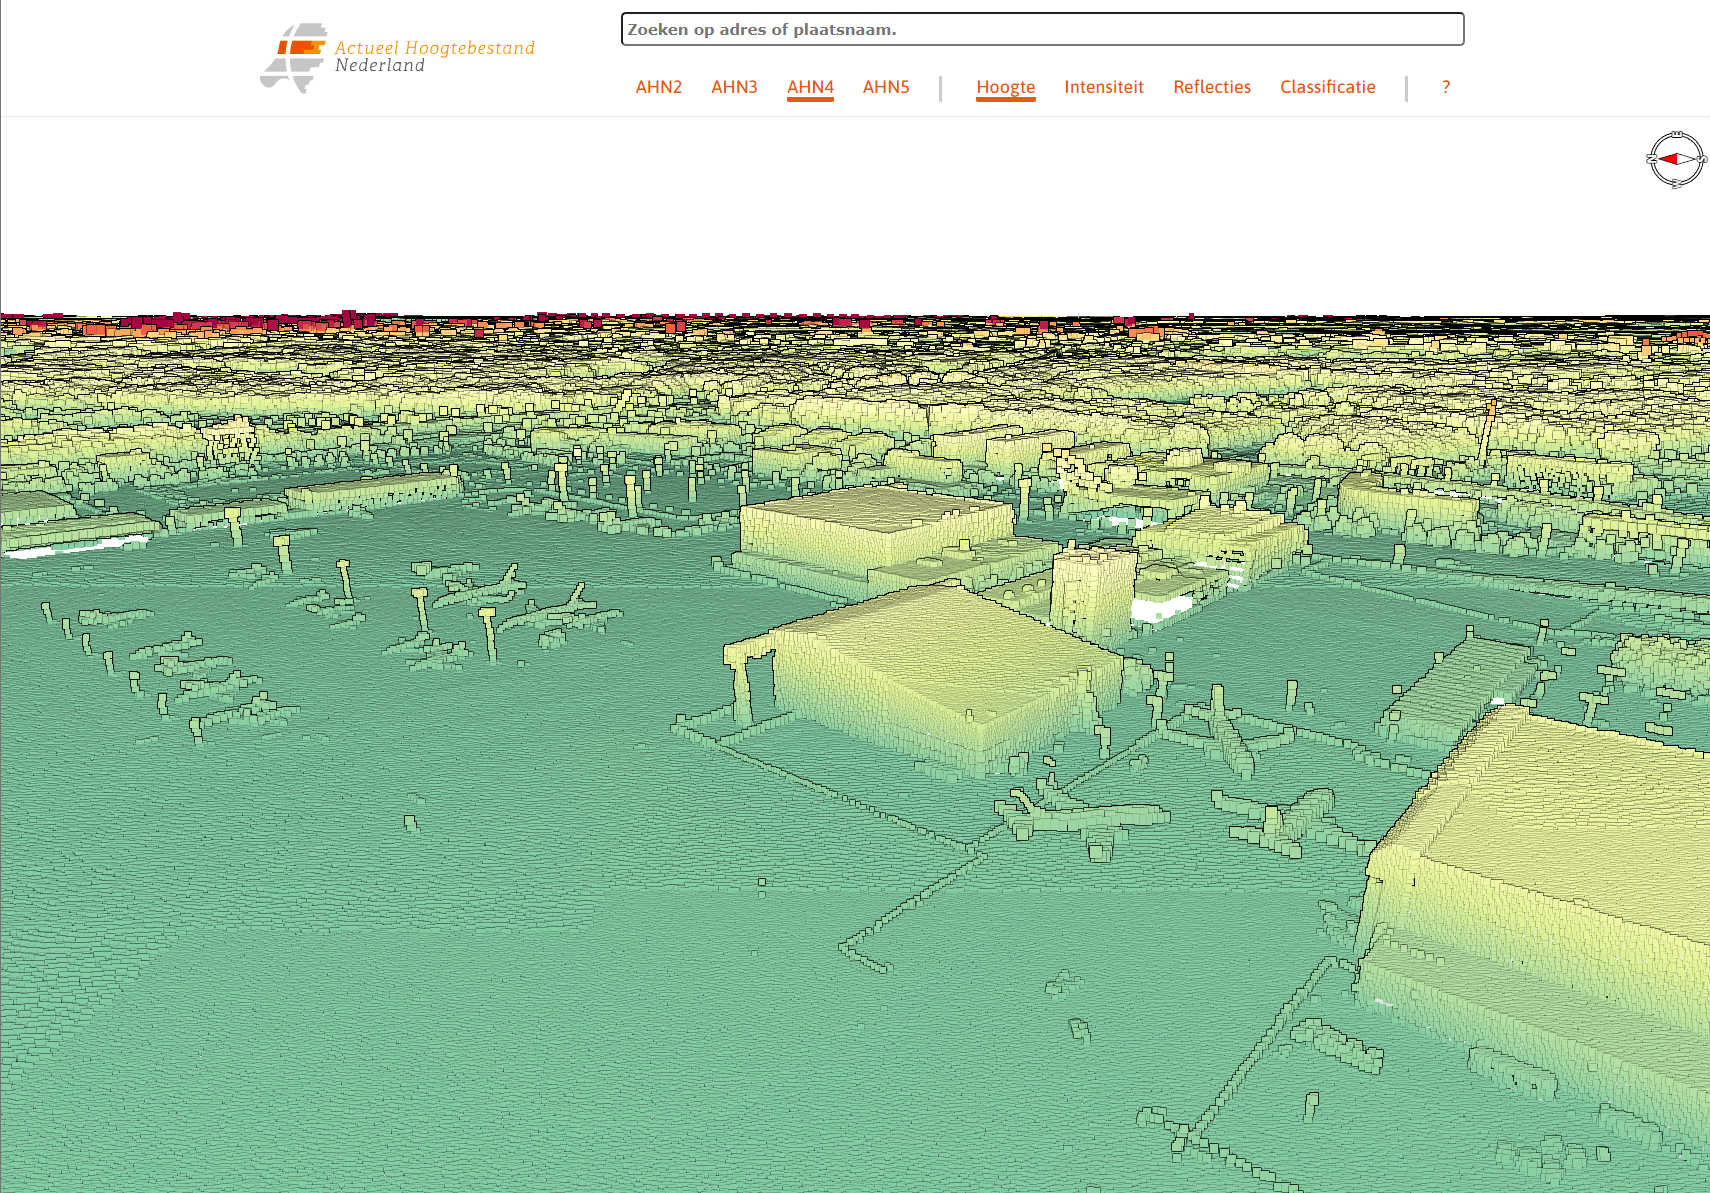
LiDAR point cloud of EHAM Schiphol — millions of measured points forming the airport geometry
How photogrammetry works
Photogrammetry reconstructs 3D geometry from 2D images. A camera — typically mounted on a drone or aircraft — captures hundreds or thousands of overlapping photographs from multiple angles. Software then identifies common features across images and triangulates their positions in 3D space. The result is a dense point cloud, a textured mesh, or both.
The strength of photogrammetry is that it captures geometry and texture simultaneously. The same images used to build the 3D model also provide the color and surface detail that make the model look realistic. For flight simulation, this is significant. You get a model that's geometrically correct and visually detailed in a single capture pass.
The weakness is that photogrammetry struggles with certain materials. Glass, water, uniform dark surfaces like fresh asphalt, and any highly reflective or transparent surface can confuse the feature-matching algorithms. Airports have a lot of glass (terminal facades, control towers) and a lot of flat dark pavement, which means photogrammetry datasets almost always need manual cleanup in these areas.
How LiDAR works
LiDAR measures geometry directly. A laser scanner emits pulses and records the time each pulse takes to return, giving precise distance measurements. A typical airborne LiDAR system captures millions of points per second, producing a dense point cloud with centimeter-level accuracy regardless of surface material or lighting conditions.
The advantage is consistency. LiDAR doesn't care whether a surface is black, white, reflective, or transparent. It measures the same way in every condition. It also penetrates vegetation, meaning you get ground-level terrain data even where trees and bushes obscure the surface — critical for accurate terrain modeling around airports with wooded approaches.
The limitation is that LiDAR captures geometry only. There's no color, no texture, no surface detail. A LiDAR point cloud tells you exactly where every surface is, but not what it looks like. To build a visually realistic model, you need to add textures from a separate source — either photogrammetry imagery, satellite imagery, or hand-painted materials.
This is the core trade-off: photogrammetry gives you geometry plus appearance in one pass, but with accuracy limitations on certain surfaces. LiDAR gives you higher geometric accuracy across all surfaces, but requires a separate texturing workflow to make the result visually usable.
Head-to-head comparison
| Factor | Photogrammetry | LiDAR |
|---|---|---|
| Geometric accuracy | 2–10 cm depending on GSD and conditions | 1–5 cm, consistent across surfaces |
| Texture capture | Built-in — same images provide texture | None — requires separate imagery |
| Glass and reflective surfaces | Poor — feature matching fails | Good — measures directly |
| Vegetation penetration | None — sees canopy surface only | Yes — multi-return captures ground level |
| Lighting dependency | High — needs consistent daylight | None — active sensor, works in any light |
| Data volume per km² | 50–200 GB (images + mesh) | 5–30 GB (point cloud) |
| Processing time | Hours to days (compute-intensive) | Minutes to hours (direct measurement) |
| Best for sim scenery | Visual fidelity, textured models | Terrain accuracy, structural geometry |
What matters for flight simulation
Flight simulation scenery has specific requirements that shift the calculus between these two methods. The model needs to be geometrically accurate enough for approaches and departures to look correct from the cockpit. The surfaces need to be textured convincingly under dynamic lighting — dawn, noon, dusk, rain, and night. And the terrain surrounding the airport needs to be right, not just close.
For the airport itself — buildings, taxiways, aprons, runway markings — photogrammetry often provides the best starting point because it delivers geometry and texture together. A single drone survey can produce a textured 3D mesh of the entire airfield that, after cleanup, gives you a model that's both measurably accurate and visually convincing.
For the surrounding terrain and approach corridors, LiDAR is often superior because it captures the true ground surface regardless of vegetation cover. Photogrammetry sees the top of trees; LiDAR sees through them to the terrain below. For an airport surrounded by forested hills, this distinction directly affects whether the terrain model shows the right visual picture on approach.
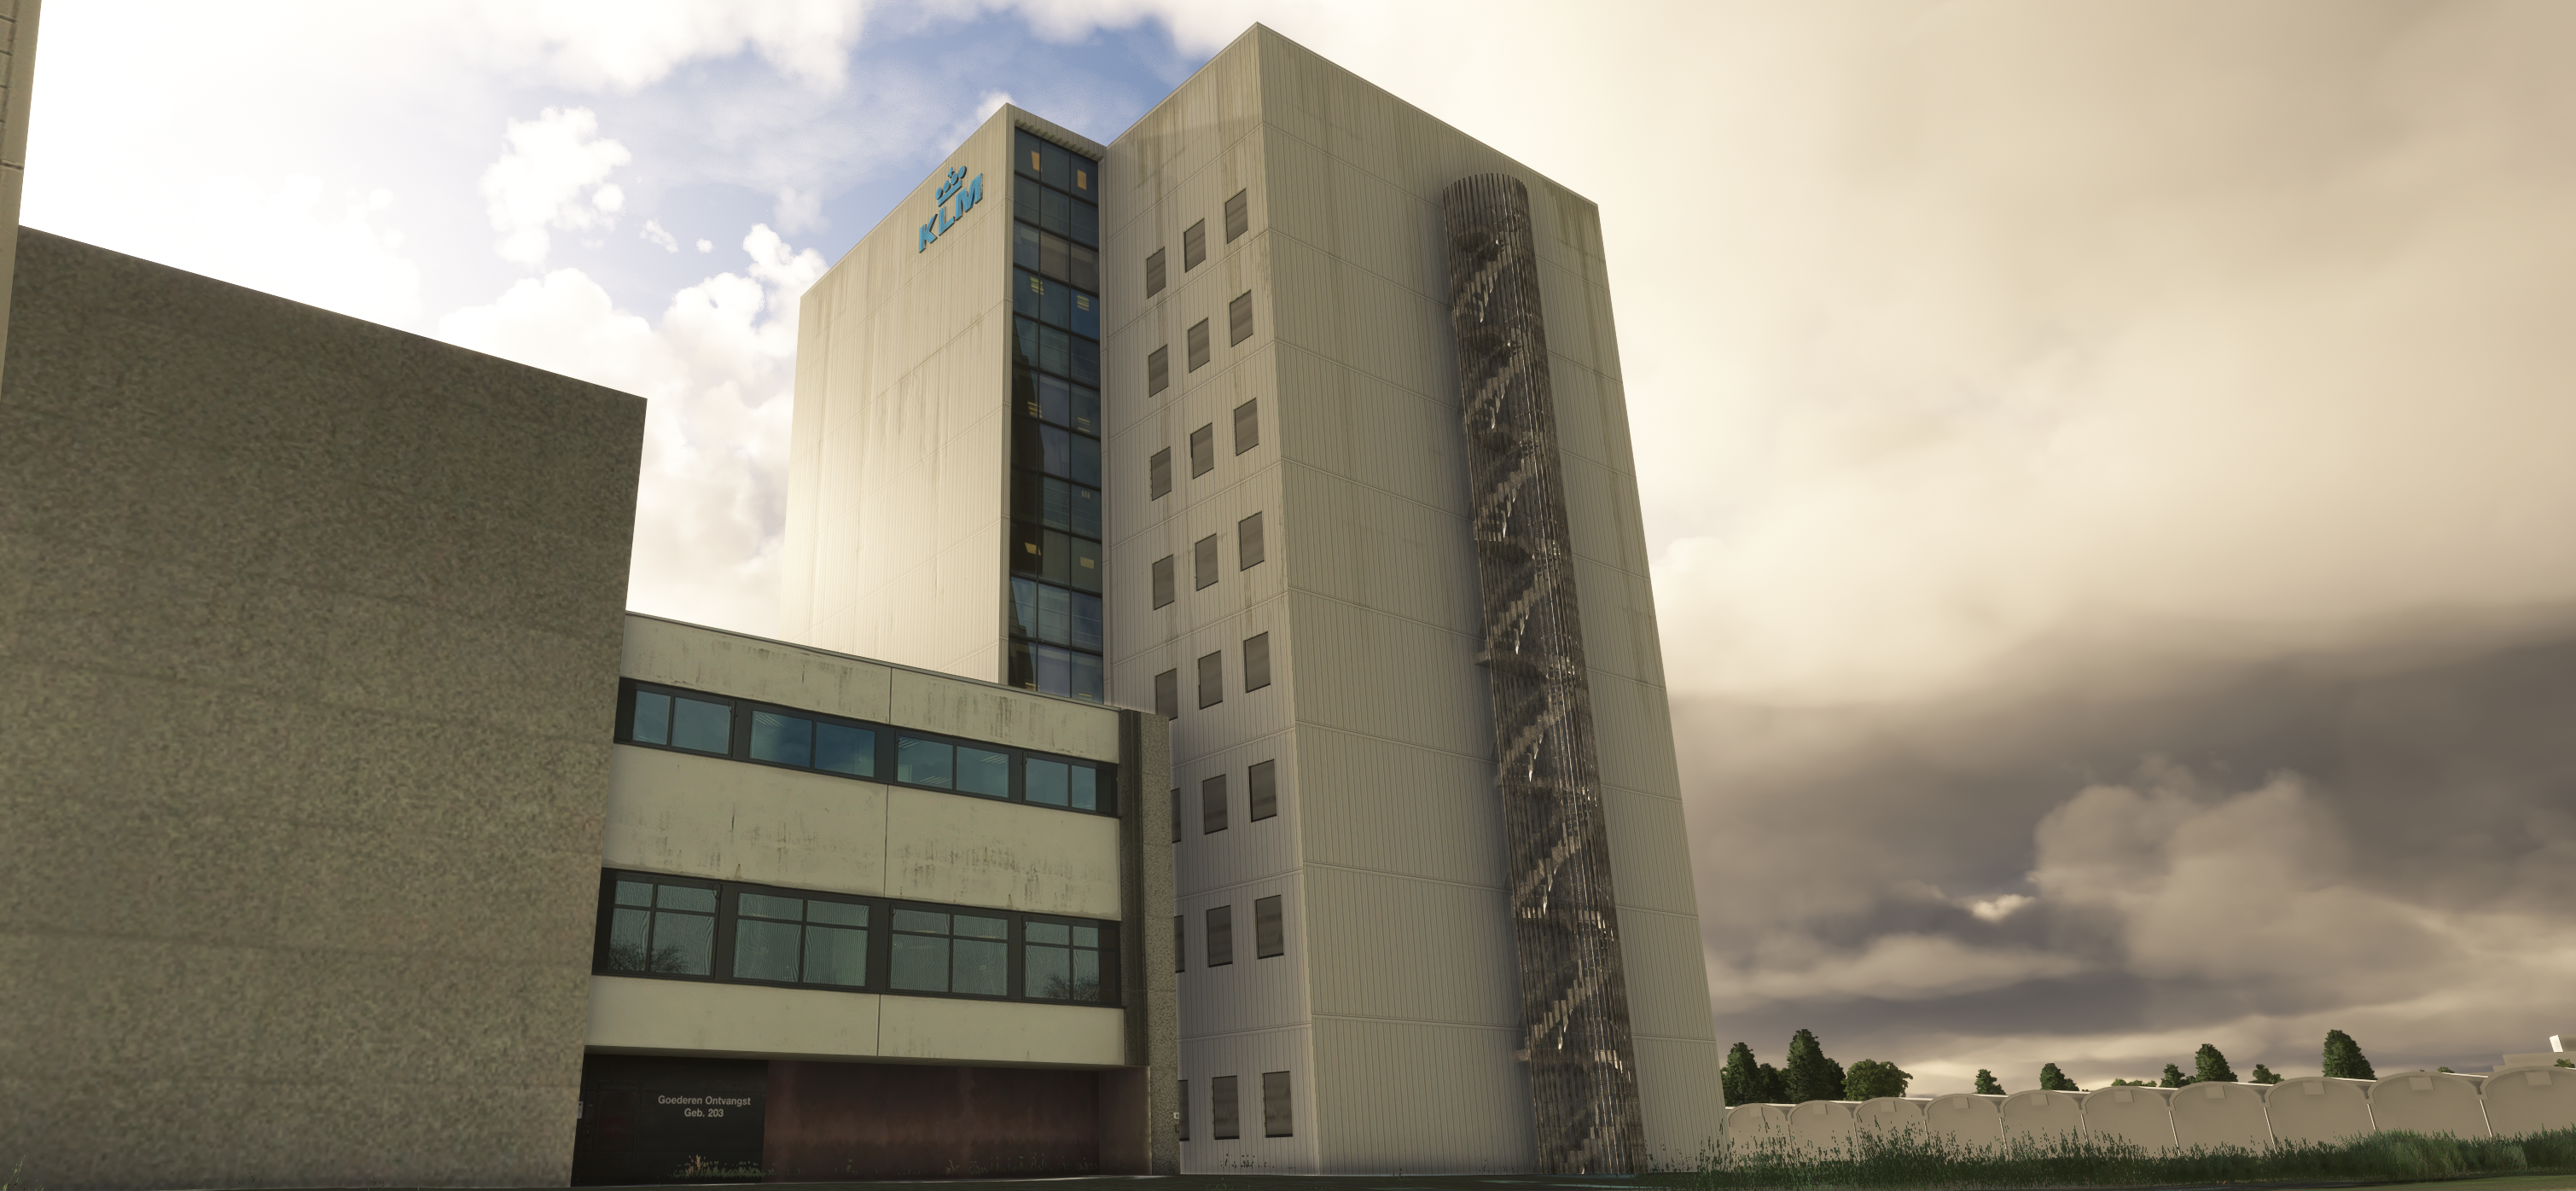
Reconstructed airport geometry — photogrammetry capture combined with manual refinement
The hybrid approach
In practice, the best airport digital twins use both methods. LiDAR provides the geometric backbone — accurate terrain, precise building footprints, correct runway elevations. Photogrammetry provides the visual layer — realistic textures, surface detail, color information that makes the model look like the real thing under dynamic lighting.
The workflow typically starts with LiDAR-derived terrain and building shells, then drapes photogrammetric textures over the geometry. Where photogrammetry fails — glass facades, shadows under bridges, areas obscured by parked aircraft during the survey — the geometry falls back to the LiDAR data with manually authored PBR materials applied.
Terrain modeling
LiDAR preferred. Penetrates vegetation, captures true ground surface. Critical for approach corridors and obstacle assessment.
Terminal buildings
Hybrid. LiDAR for precise footprints and heights, photogrammetry for facade textures and architectural detail.
Apron and taxiways
Photogrammetry preferred. Captures markings, surface wear, and pavement variation that pilots use for orientation.
Navaids and lighting
LiDAR preferred. Thin structures like approach light stanchions and ILS antennas are precisely located in point clouds.
Open data sources
Not every project requires a commissioned survey. Governments worldwide are increasingly releasing LiDAR datasets as open data. The Netherlands (AHN), the United Kingdom (Environment Agency), the United States (USGS 3DEP), and many other countries have publicly available LiDAR coverage at resolutions suitable for simulation work. Similarly, high-resolution satellite photogrammetry is available commercially at sub-meter ground sample distances.
The quality of these open datasets varies. Some provide centimeter-level accuracy with recent capture dates. Others are older, lower resolution, or have gaps. Part of our workflow at PSSW involves evaluating which open data sources meet the accuracy requirements for each airport and supplementing with commissioned surveys where they don't.
What we use
Our pipeline is built around both methods. For terrain, we start with the highest-resolution LiDAR available and validate it against published approach plate data. For airfield surfaces, we use photogrammetry where coverage exists and supplement with manual modeling from orthoimagery where it doesn't. Building facades get a combination of photogrammetric texture and hand-authored PBR materials to ensure they respond correctly to the simulator's dynamic lighting engine.
The specific mix depends on the airport. A field in the Netherlands benefits from AHN4 LiDAR at 10+ points per square meter — some of the densest national coverage in the world. An airport in the Canary Islands might rely more heavily on satellite photogrammetry and locally sourced orthoimagery. In every case, the geometry goes through the same validation pipeline: does the model match the published charts, and does the visual picture from the cockpit match reality?